
Plant Growth Data Challenge
Analyze plant growth data, draw a graph, and explain your findings. Practice math and science reasoning in this short extra-credit challenge.

Explore new ideas, classroom activities, real-world connections, and stories from our classroom.
 Explore.
Analyze plant growth data, draw a graph, and explain your findings. Practice math and science reasoning in this short extra-credit challenge.

Practice math and science skills in a short, two-part extra-credit activity. Show your understanding through clear work and explanations.
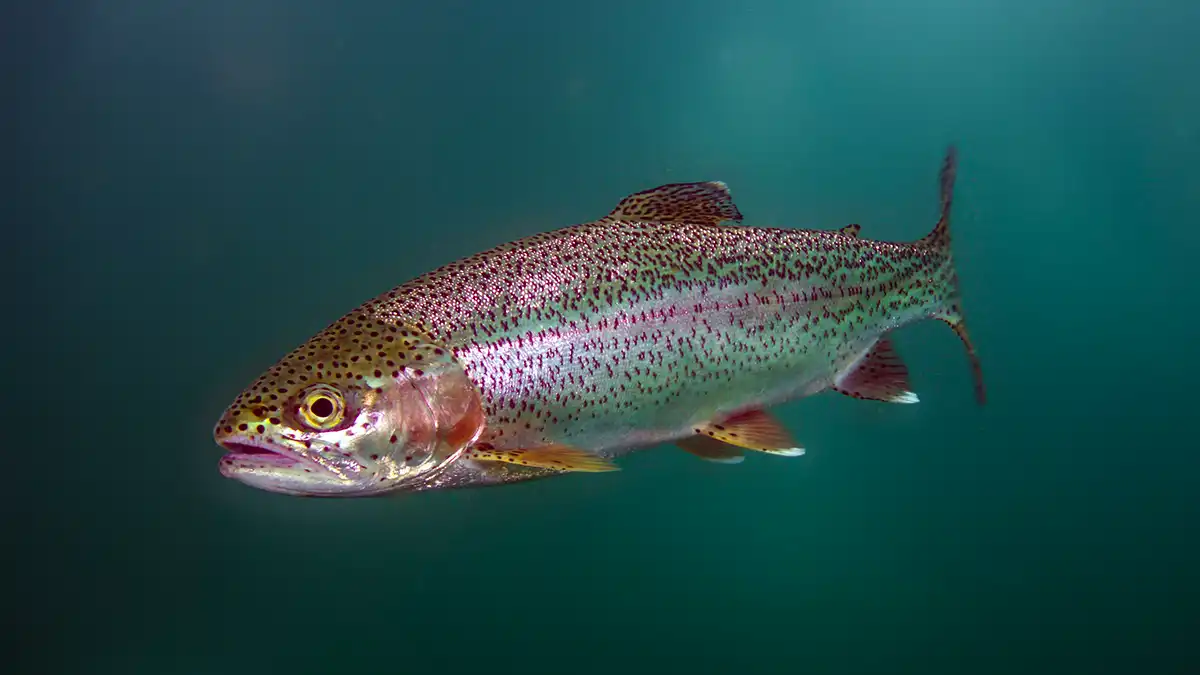
Create a circular art project showing the rainbow trout life cycle. Connect each stage to seasonal changes and survival needs.
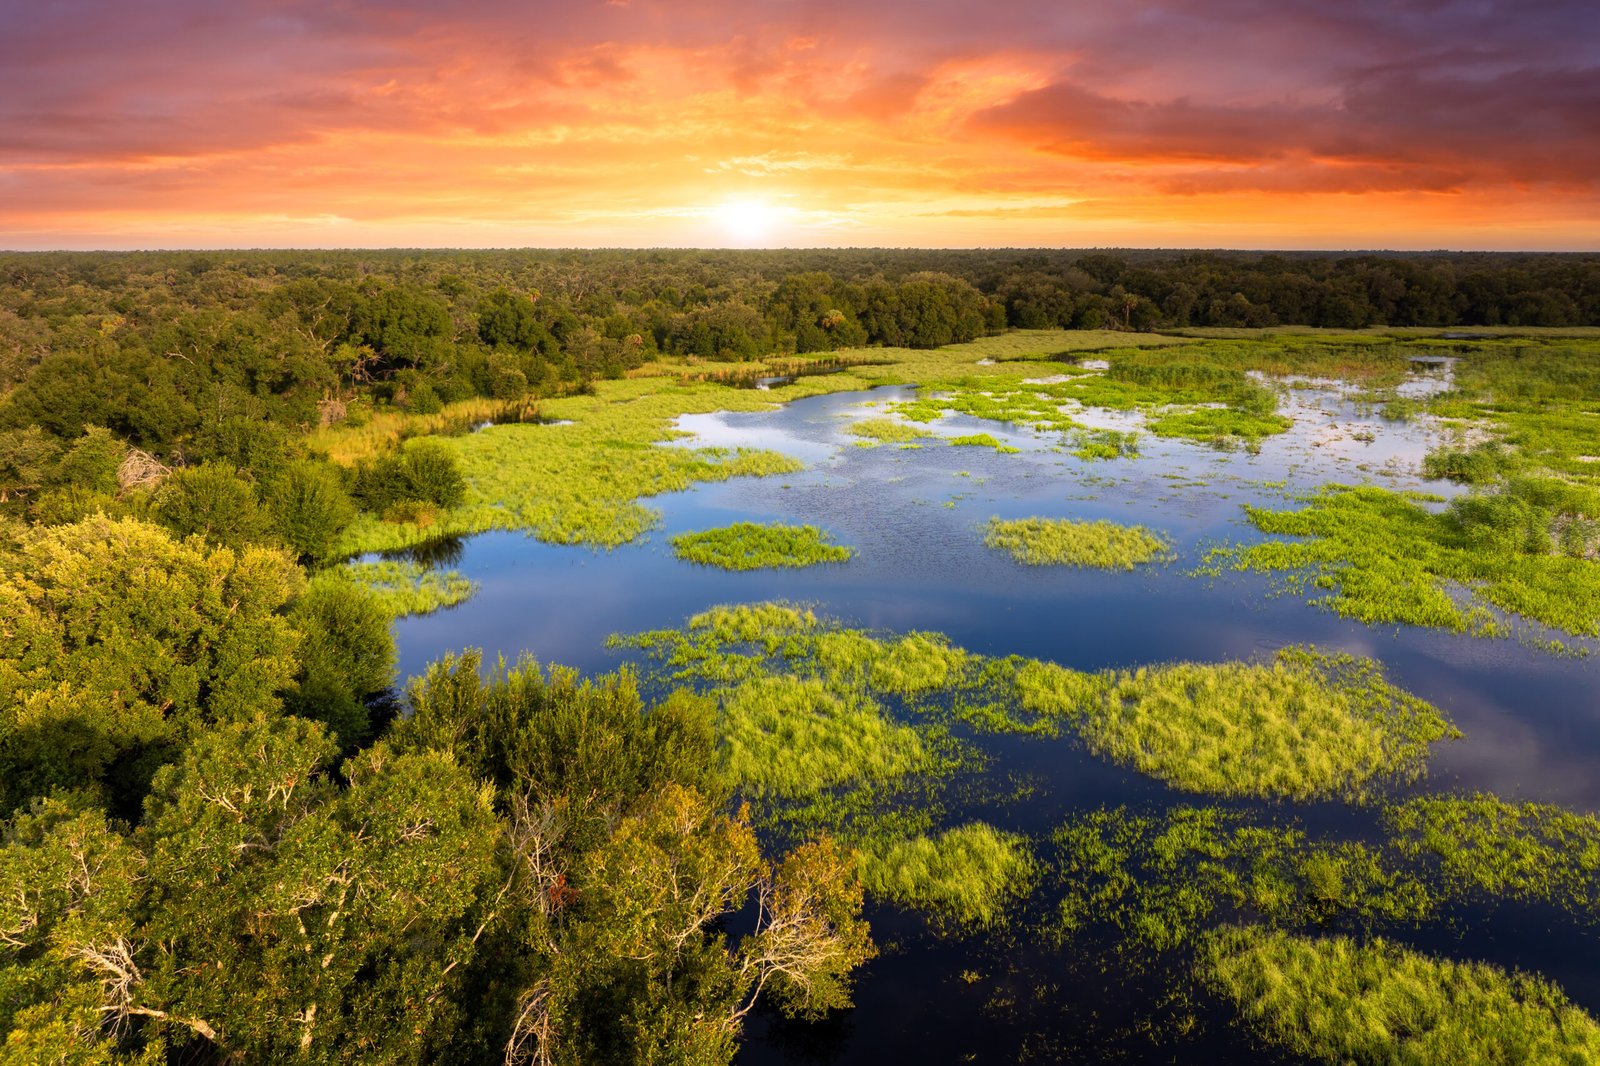
Explore how wetlands support wildlife and connect land with water. Learn why these habitats matter to fish and other living things.
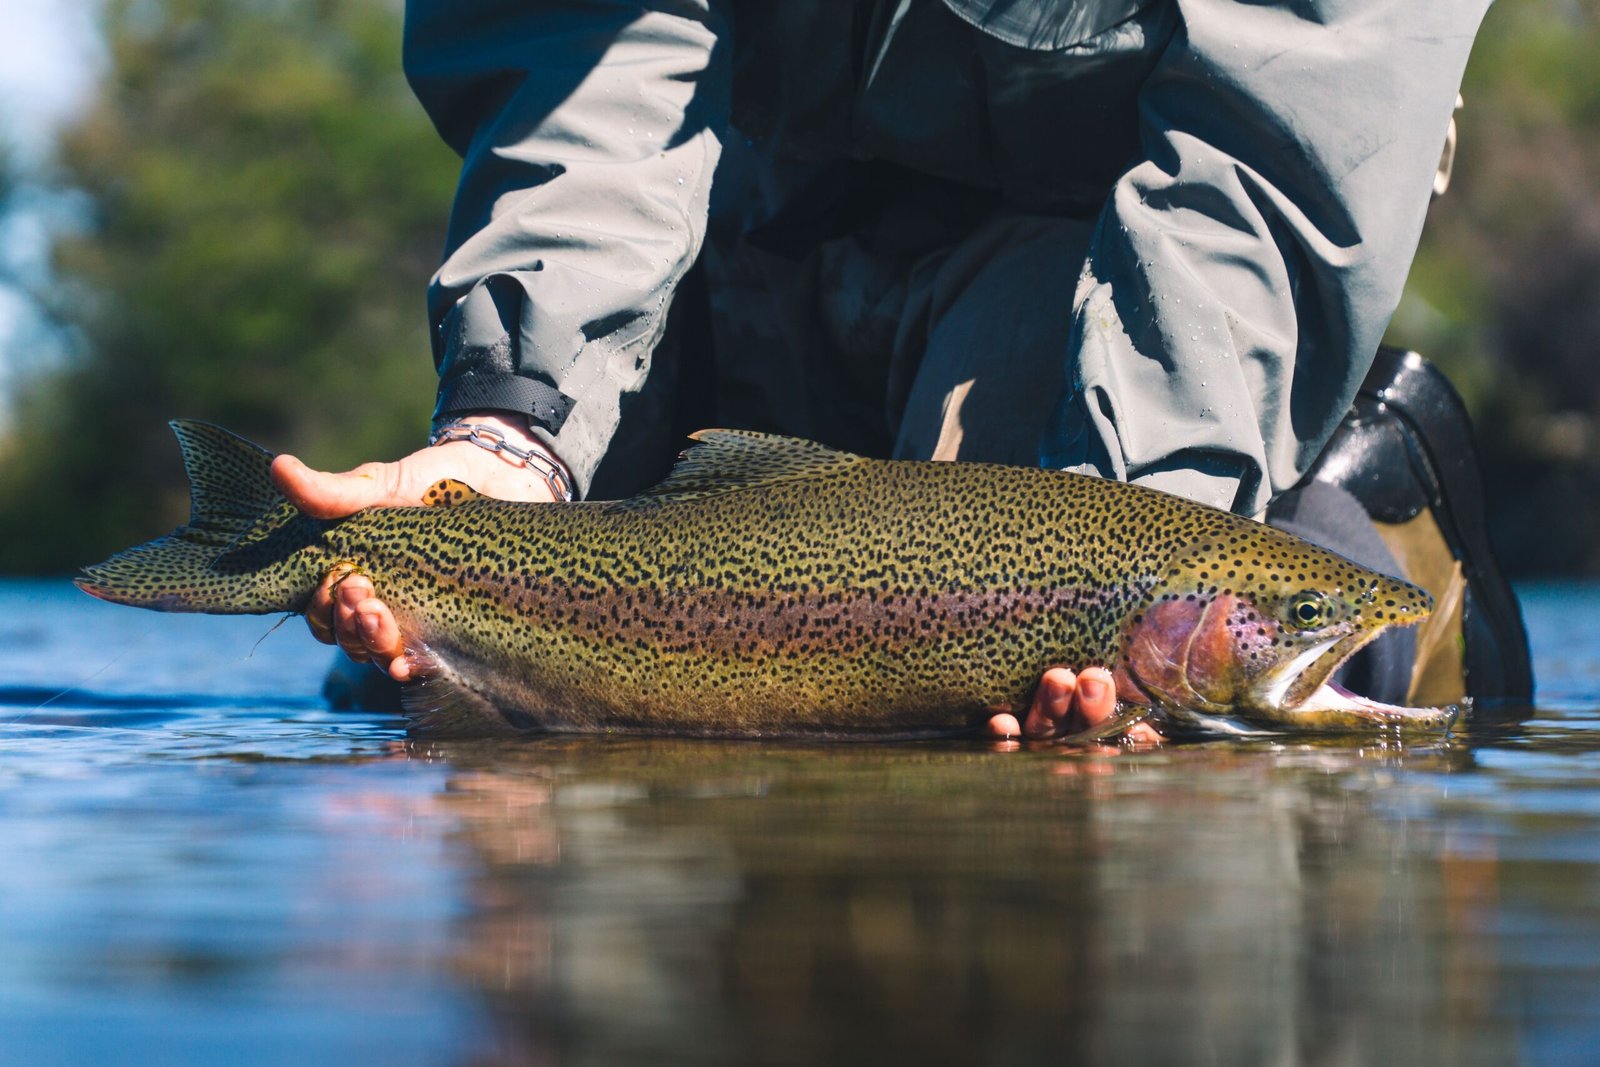
Follow rainbow trout through their life cycle. Explore the habitats and environmental conditions they need to grow and survive.

Examine a puzzling object from an inventor’s workshop. Use the clues and your imagination to explain what it might do.

Read about Maya’s difficult science project group. Explore the tension and challenges that can arise when classmates must work together.

Reset your classroom habits after a break. Reflect on expectations, rebuild routines, and plan a focused return to learning.

Imagine your ideal Christmas break with no budget limits. Practice descriptive writing as you explain the experiences you would choose.